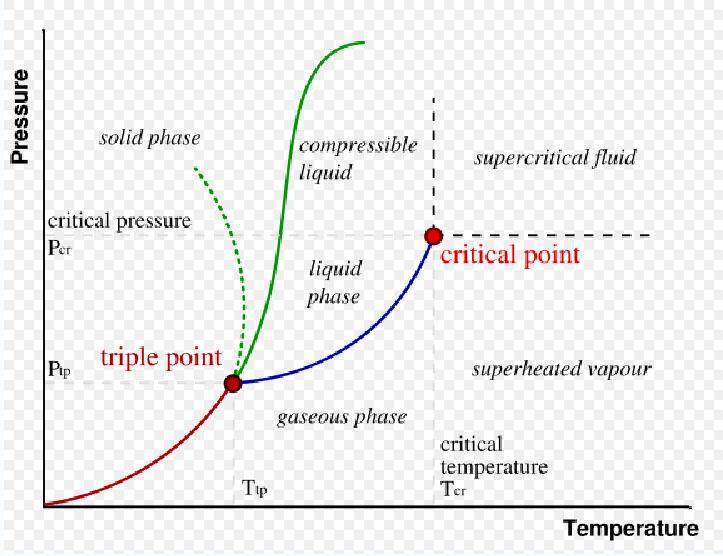
Phase diagrams are a graphic or pictoral way of showing the effect of temperature and pressure on the states of a substance. In simplest terms the diagrams shows at what temperatures and pressures a substance will be a solid, liquid or gas.
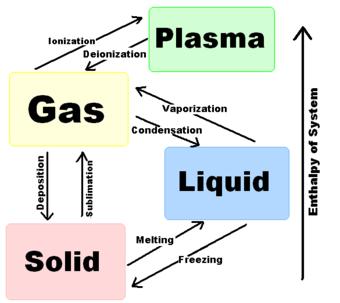
There are terms for the transition from one phase to another that you should know (shown below). The table below lists the terms and the thermodynamic property that accompanies each of the transitions:
 |
|
||||||||||||||||||||
|---|---|---|---|---|---|---|---|---|---|---|---|---|---|---|---|---|---|---|---|---|---|