
BCH 4053--General Biochemistry I--Spring 2003
 |
 |
|
BCH 4053--General Biochemistry I--Spring 2003 |
|
This is a group problem. It is due on Wednesday, April 2.
A biochemist studying the properties of a newly isolated metabolic enzyme obtains the following rate data during kinetic experiments in the absence and presence of two different inhibitors, A and B, one a substrate analogue.
|
|
|
|
|
|
5.0 |
1.25 |
0.74 |
0.48 |
|
2.5 |
0.87 |
0.45 |
0.33 |
|
1.7 |
0.67 |
0.32 |
0.25 |
|
1.2 |
0.54 |
0.25 |
0.20 |
|
1.0 |
0.45 |
0.21 |
0.17 |
Inhibitor A concentration is 5 x 10⁻⁴ M; that of B is 3.2 x 10⁻⁶ M. Note that the highest substrate concentration is 5 x 10⁻⁴ M.
Plot the non-inhibited data by four different graphing methods on four separate sheets of graph paper: (Computer generated graphs are okay. Otherwise use graph paper where the smallest division is no larger than 1 millimeter).
Lineweaver-Burk (1/v versus 1/S)
Hanes-Wolff (S/v versus S)
Eadie-Hofstee (v versus v/S) (not in book; see chapter 14 lecture notes, slide 51)
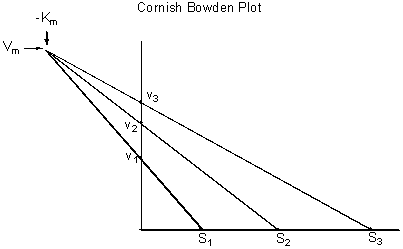
Cornish-Bowden (direct plot, not in book, explained below)
Determine Vmax and KM from each plot, showing on the graph paper how you determined them. (Note: Pick your axes and scales carefully so that the lines may be extrapolated appropriately. It would be a good idea to draw the graph on scratch graph paper first, then do a clean finished copy.)
Plot the data for the inhibited reactions on the Lineweaver-Burk plot only, along with the non-inhibited data. Classify the inhibitors as competitive, mixed non-competitive, non-competitive, or uncompetitive.
Obtain a cover sheet by clicking here, fill it out neatly with your data, and all group members sign their names on the sheet. STAPLE the cover sheet to the four graphs and turn in as a packet.
The problem is worth a possible 5 points, 1 point for each graph and 1point for the final data summary. I will deduct points for poor selection of graph coordinates, or sloppy graphs!
Cornish-Bowden direct plot:
Set up your axes as if you were going to do a direct v vs S hyperbolic plot. Instead of plotting a point on the graph at each v,S coordinate, though, plot each v and corresponding S value on the corresponding axis. (say the velocity was 2.1 at a substrate concentration of 5.0, then you would put a point on the v axis at 2.1 and a point on the S axis at 5.0. Then connect these two points with a straight line, extending the line into the negative S quadrant. Make a separate line for each v and S combination. Note where the lines cross. (If the data represents a rectangular hyperbola, the lines should all cross at Vmax and -KM.)

|