

BCH 4053--General Biochemistry I--Spring 2003
 |
 |
|
BCH 4053--General Biochemistry I--Spring 2003 |
|
Calculated data:
|
1/[S] M-1 |
1/v no inhibitor min/mmol |
1/v inhibitor A min/mmol |
1/v inhibitor B min/mmol |
|
0.20 x 10⁴ |
0.80 |
1.35 |
2.08 |
|
0.40 x 10⁴ |
1.15 |
2.22 |
3.03 |
|
0.59 x 10⁴ |
1.49 |
3.13 |
4.00 |
|
0.83 x 10⁴ |
1.85 |
4.00 |
5.00 |
|
1.00 x 10⁴ |
2.22 |
4.76 |
5.88 |
Calculated Results:
|
Plot |
Km |
Vmax |
|
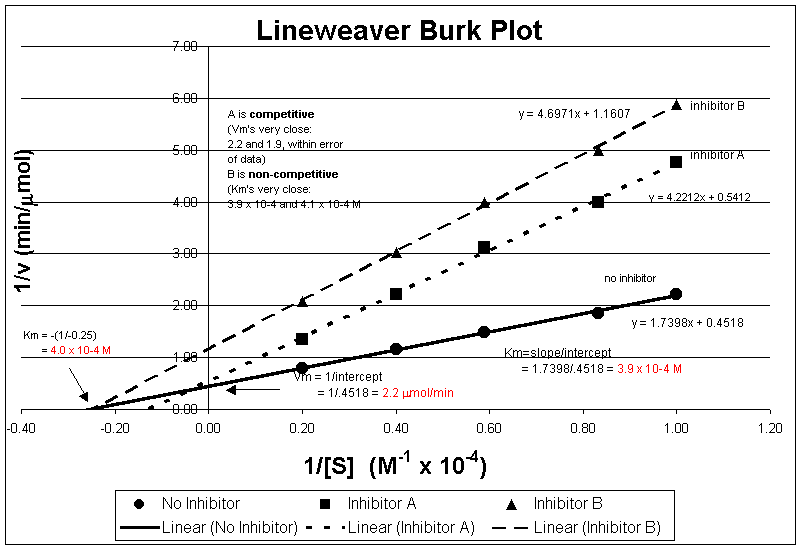
Lineweaver-Burk |
4.0 x 10⁻⁴ M |
2.2 mmol/min |
|
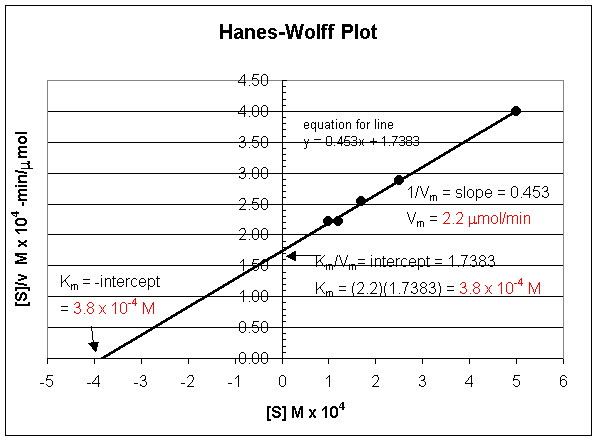
Hanes-Wolff |
3.8 x 10⁻⁴ M |
2.2 mmol/min |
|
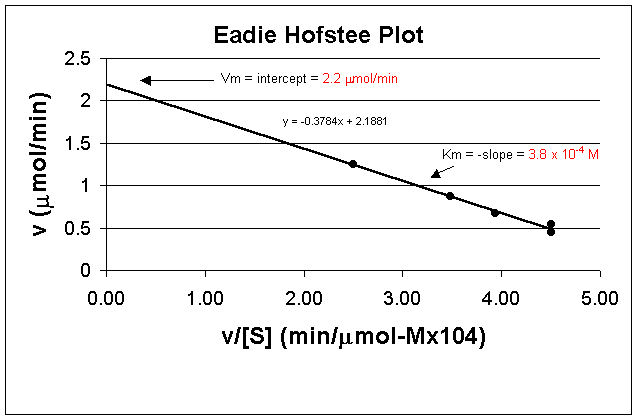
Eadie-Hofstee |
3.8 x 10⁻⁴ M |
2.2 mmol/min |
|
Cornish Bowden |
3.7 x 10⁻⁴ M |
2.1 mmol/min |
Inhibitor classification:
Inhibitor A Competitive (within experimental error)
Inhibitor B Pure non-competitive (within experimental error)
Kinetic Data:
|
v |
[S] |
|
mmol/min-mg |
M x 104 |
|
1.25 |
5 |
|
0.87 |
2.5 |
|
0.67 |
1.7 |
|
0.54 |
1.2 |
|
0.45 |
1 |
Plot each data set as a separate line with a y intercept of v, and an x intercept of [S]. This gives the following family of straight lines, which are extended to the negative [S] quadrant:
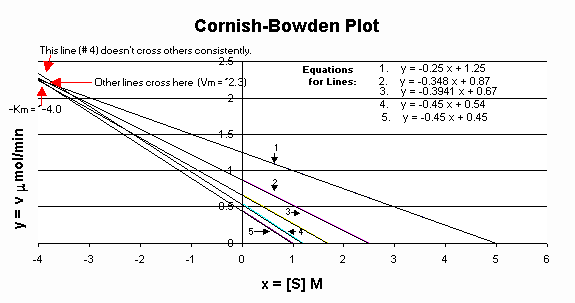
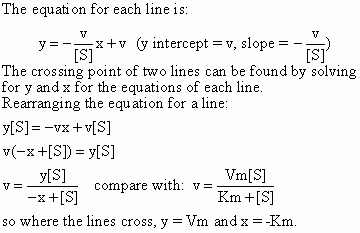
If all of the v, [S] points fall on a rectangular hyperbola, then the lines should all cross at the same point, which would give Vm and -Km. There can be errors in the data points, however, and the extent of the error (or deviation from a rectangular hyperbola) can be estimated by how much the crossing points deviate from each other. Drawing a box around the crossing points gives a feeling for the potential error in Vm and Km one can get from the data. (The Km would lie within the width of the box, the Vm would lie within its height).
In the above data, line two is clearly deviating from the other lines. We can illustrate this by calculating the y and x values for each line crossing, i.e. solve for y and x for each possible pair of equations:
|
Line Pair |
All Pairs |
Excluding Line 4 |
||
|
x |
y |
x |
y |
|
|
1&2 |
-3.9 |
2.2 |
-3.9 |
2.2 |
|
1&3 |
-4.0 |
2.3 |
-4.0 |
2.3 |
|
1&4 |
-3.6 |
2.1 |
||
|
1&5 |
-4.0 |
2.3 |
-4.0 |
2.3 |
|
2&3 |
-4.3 |
2.4 |
-4.3 |
2.4 |
|
2&4 |
-3.2 |
2.0 |
||
|
2&5 |
-4.1 |
2.3 |
-4.1 |
2.3 |
|
3&4 |
-2.3 |
1.6 |
||
|
3&5 |
-3.9 |
2.2 |
-3.9 |
2.2 |
|
4&5 |
Don’t cross |
Don’t cross |
||
|
Average: |
-3.7 |
2.1 |
-4.0 |
2.3 |
Therefore including line 4, Km is 3.7 x 10⁻⁴ M, Vm is 2.1 m mol-min-1-mg-1
and excluding line 4, Km is 4.0 x 10⁻⁴ M, Vm is 2.3 m mol-min-1-mg-1.
|